
Algorithm Visualization Tutorials
This topic hub is for readers who do not want an algorithm to remain a black box after the code compiles. The main route starts with the eight queens problem because it exposes the core mechanics of backtracking: a partial state, a candidate move, a conflict test, a recursive step, and a rollback. The same route then moves into bitmask optimization so the reader can see how a clearer mathematical representation changes the cost of each check.
The goal is not to replace formal algorithm study with animation. Visualization is useful when it makes hidden state visible: which columns are still available, which diagonals are blocked, how the search tree narrows, and where repeated work disappears. Each article should leave the reader with a concrete trace that can be compared against the source code.
How to Use This Route
Start with the classic backtracking explanation if you are still building recursion intuition. Read the call stack and board state before looking at optimization. Then move to the bitmask version and compare the conflict checks line by line: arrays and loops become integer masks, and the pruning logic becomes a small set of bit operations. After that, the K-means material shows a different style of iterative algorithm where the state is no longer a board but centroids, assignments, and SSE.
When reviewing the examples, focus on the invariant that each implementation preserves. For N-Queens, the invariant is that no two queens share a column or diagonal in the current partial board. For K-means, the invariant is that each iteration alternates between assignment and center update. The visual layer is only useful when it helps verify those invariants instead of merely showing attractive motion.
What Makes the Content Useful
A valuable algorithm page should include the problem definition, the state representation, the update rule, a complexity discussion, and at least one failure mode. For this site, that means explaining why a naive N-Queens implementation repeats conflict checks, why bitmasks reduce the bookkeeping cost, and why K-means can converge to different local optima depending on initialization. The companion playground and diagrams are there to make those claims inspectable.
Using the Playground as Evidence
The browser playground is meant to support the written explanation, not replace it. When a page shows a search tree, board state, centroid movement, or prediction panel, the reader should be able to connect the visual state to a named variable or operation in the code. If the visualizer cannot be mapped back to the implementation, it becomes decoration rather than evidence.
A good way to use the playground is to pause after each state change and ask which invariant still holds. In N-Queens, the visible board should match the current row, occupied columns, and diagonal masks. In K-means, the visible points and centers should match the assignment and update step. If the animation and the code disagree, the article should treat that as a bug to investigate rather than hide it behind a polished interface.
For that reason, the strongest visualization pages also point back to source-level decisions: why a data structure was chosen, what the loop updates, what condition stops the run, and which output confirms that the implementation did not merely produce an attractive trace. The visual layer should make the code easier to audit.
First Step in Animation: Generate Asset Layers
Algorithm visualization is useful outside code as well. Character-to-animation asset work has the same requirement: make hidden intermediate state visible. Which pixels belong to the same layer, which fragments should be filtered, and which edges should remain hard SVG paths?
Animation Asset Lab puts that step in the browser: local decoding, local upscaling, local segmentation, and local SVG/PNG export. The companion article explains how a heavier offline pipeline can use SAM and vtracer.
Common Misreadings
Visualization can make an algorithm look simpler than it is. A board animation may hide the cost of checking candidates, and a cluster diagram may hide scaling, initialization, and metric choices. This route deliberately pairs visuals with implementation notes so the reader can see both the intuitive movement and the computational cost behind it.
Readers should also avoid treating one successful trace as a proof of correctness. A correct algorithm needs a clear state definition, termination condition, update rule, and test cases that cover edge behavior. The visual trace is a debugging aid. The explanation, code, and reproducible output together provide the stronger evidence.
When a future page adds a new visual example, it should explain which part of the algorithm is being visualized, which part is omitted, and how the reader can verify the omission from code or output.
Algorithm Visualization Evidence Matrix
| Algorithm type | What the visual should show | Code-level evidence | Commonly missed boundary |
|---|---|---|---|
| Backtracking search | Current row, candidate column, conflict test, and rollback state. | Recursive argument, state arrays, pruning condition, and first solution output. | An animation can hide how many branches were pruned. |
| Bitmask optimization | available, pick, and changing diagonal attack masks. |
Bitwise OR, complement, lowest set bit, left shift, and right shift expressions. | Bit width truncation and column direction are easy to misread. |
| K-means iteration | Sample assignment, centroid movement, SSE reduction, and restart variation. | Scaling parameters, initialization seed, assignment/update loop, and final SSE. | A two-dimensional plot does not represent the whole four-dimensional feature space. |
| Browser playground | User input, running state, output result, and error message. | Input validation, state machine, rendered data, and downloadable materials. | A smooth interface is not proof that the algorithm is correct. |
Topic hub
Algorithm Visualization Tutorials
An interactive hub for eight queens, N-Queens, backtracking, bitmasks, complexity, and browser-based algorithm demos.
Designed for searches around eight queens backtracking, bitmask optimization, N-Queens complexity, and algorithm visualization playgrounds.
Editorial notes
Why these articles belong in one route
Algorithm visualization is not decoration next to code. It exposes state changes, pruning conditions, and the source of complexity. The eight queens route connects the same problem across array state and bitmask state.
The backtracking article focuses on the recursion stack, candidate columns, and conflict checks. The bitmask article compresses columns and diagonals into integer masks so readers can compare cost and readability.
K-means belongs in the same hub because it shows a different kind of iterative algorithm: the state is no longer a board, but centroids, sample assignments, and SSE changing over time.
What you will build
You will see how the same problem moves from classic backtracking to bitmask optimization, then inspect the search in the playground.
Recommended reading order
Start with concepts, then move into runnable projects
Eight queens with classic backtracking
Start with state representation, conflict checks, recursive search, and the full C/Python solving flow.
Bitwise optimization for the eight queens problem
Move from array-based checks to compact bit masks so the same search becomes faster and easier to reason about.
K-means clustering on the Iris dataset in C
Study standardization, K-means++ initialization, restart selection, SSE, and the final clustering result.
Resources and distribution assets
Code, data, diagrams, and share assets in one place
Algorithm Implementation Project / DIAGRAM
K-means flowchart

SVG flowchart for the C program execution path.
Algorithm Implementation Project / DIAGRAM
Cluster visualization
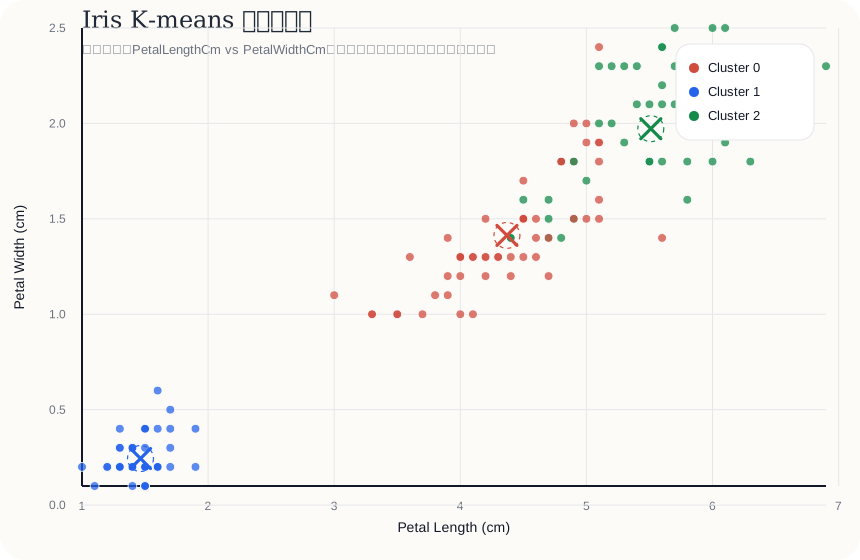
A 2D scatter projection using petal length and petal width.
Algorithm Implementation Project / ARCHIVE
K-means zip package
Contains dataset, source code, flowchart, and visualization.
Algorithm Implementation Project / SOCIAL
Algorithm Visualization share card
A 1200x630 SVG card for eight queens, backtracking, bitmasks, and the playground.
Site Building Project / VIDEO
SEO distribution short-video storyboards
Four 45-60 second storyboard scripts ready for later Remotion production.
FAQ
Direct answers to common search questions
Why pair algorithm articles with a playground?
The playground makes recursion, backtracking, and iteration states observable, which lowers the cost of reading code-only explanations.
Why do some English pages link to Chinese algorithm posts?
Some long algorithm posts are currently published only in Chinese. The English hub provides English context first, with full translations planned later.