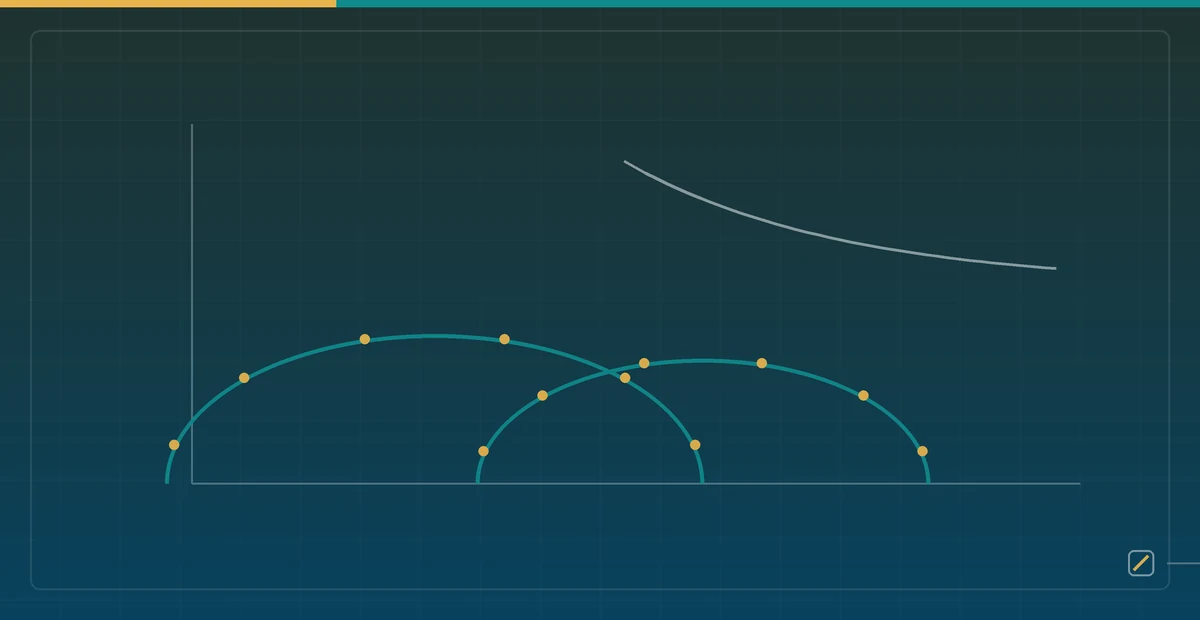

Impedance spectroscopy is not one more battery feature. EIS compresses an entire hierarchy of timescales — from ultrafast electron transport to macroscopic solid-phase diffusion — into the frequency domain: the high-frequency intercept fixes ohmic resistance, the mid-frequency arc parameterises charge-transfer kinetics and SEI double-layer capacitance, and the low-frequency Warburg tail governs the finite-boundary diffusion limit. One measurement, three physical layers at once.
Turning that into usable machine learning labels is not about producing a plausible-looking Nyquist plot. The hard part is that an impedance spectrum is inherently underdetermined — very different parameter combinations produce nearly identical curves. This article covers how to break that degeneracy, and what to record so the curves still mean something six months later.
PyBaMM battery modelling series · Data pipeline (part 2 of 4): Previous: Reading PyBaMM Fast: Architecture for Battery Modeling and AI Data · Next: Generate Battery Aging and EIS AI Datasets with PyBaMM · Series hub: Data pipeline (4) + Silent failures, measured (7) · RSS feed.
1. The complex-analysis foundation
A small-signal EIS response is a linear perturbation about a nonlinear steady-state operating point. The base object is the complex impedance transfer function:
$$ Z(\omega) = \frac{\tilde{V}(\omega)}{\tilde{I}(\omega)} = Z_{re}(\omega) + j Z_{im}(\omega) $$
In an equivalent circuit model, an \(n\)-th order RC network coupled to a Warburg element \(Z_W\):
$$ Z_{ECM}(s) = R_\Omega + \sum_{k=1}^{n} \frac{R_k}{1 + s R_k C_k} + Z_W(s), \quad s = j\omega $$
Physics-driven AI needs far more than curve fitting. The features must be physically bounded quantities derived from continuum equations (concentrated solution theory, Butler-Volmer kinetics):
- High-frequency ohmic intercept \(R_\Omega\): the \(\omega \to \infty\) limit, dominated by electrolyte conductivity and current-collector contact resistance.
- Charge-transfer arc: \(-\max(Z_{im})\), corresponding to double-layer capacitance \(C_{dl}\) and charge-transfer resistance \(R_{ct}\), modulated by porous-electrode specific surface area.
- Warburg diffusion tail \(\sigma_W\): the asymptotic phase shift as \(\omega \to 0\), describing lithium intercalation into graphite and NMC lattices.
Note the premise: linear perturbation. The whole mathematics of EIS rests on small-signal linearisation — push the amplitude too far and system nonlinearity invalidates the definition of impedance itself. This resurfaces in the validity check below.
2. Generating the frequency response in PyBaMM
First, a versioning problem that stops a lot of people: EIS used to live in a separate package, pybammeis, and has since been merged into PyBaMM core. Older tutorials write import pybammeis; recent PyBaMM exposes pybamm.EISSimulation. Install the wrong package or copy the wrong import and the resulting error has nothing to do with impedance, which sends you debugging in the wrong direction.
import numpy as np
import pybamm

# Version compatibility: newer PyBaMM has it in core, older needs pybammeis
if hasattr(pybamm, "EISSimulation"):
    EISSimulation = pybamm.EISSimulation
else:
    import pybammeis                       # pip install pybammeis
    EISSimulation = pybammeis.EISSimulation

model = pybamm.lithium_ion.DFN(options={
    "surface form": "differential",        # not optional - see below
    "particle shape": "spherical",
    "SEI": "solvent-diffusion limited",
})

params = pybamm.ParameterValues("Chen2020")
params["SEI kinetic rate constant [m.s-1]"] = 1e-15

eis = EISSimulation(model, parameter_values=params)

# Log-spaced frequency vector: 1 mHz to 10 kHz
frequencies = np.logspace(-3, 4, 60)
eis.solve(frequencies)
"surface form": "differential" is mandatory. It lets the DAE solver handle double-layer capacitance correctly; without it the frequency response is structurally wrong — and nothing raises, so you get a plausible-looking curve with no physical meaning.
Getting the raw impedance array out
The official README only demonstrates nyquist_plot() and does not document how to reach the raw array, whose attribute name has moved between versions. Rather than copy a form that may not match your install, let the code find it:
def extract_impedance(eis):
    """Robustly pull the complex impedance array across PyBaMM/pybammeis versions.
    Scripts that hard-code the attribute break with AttributeError on upgrade."""
    for attr in ("solution", "impedances", "Z", "impedance"):
        z = getattr(eis, attr, None)
        if z is None:
            continue
        z = np.asarray(z).ravel()
        if np.iscomplexobj(z):
            return z
    raise AttributeError(
        f"no complex impedance array found. Available attributes: "
        f"{[a for a in dir(eis) if not a.startswith('_')]}"
    )

z = extract_impedance(eis)
nyquist_tensor = np.column_stack((frequencies, z.real, z.imag))
On first run the failure branch prints every available attribute on the object — faster than searching the docs, and more reliable than guessing.
3. Identifiability: why one Nyquist plot is not enough
This is the most important section here. A single impedance curve does not map to a unique set of physical parameters.
Intuitively: the mid-frequency arc size is set by \(R_{ct}\), and \(R_{ct}\) depends jointly on exchange current density, electrode specific surface area and temperature. Halve the surface area and double the exchange current density and the arc barely moves. What the data shows you is their product, not the individual values. Fitting an equivalent circuit to a measured spectrum runs into the same kind of degeneracy; the site’s EIS equivalent-circuit fitter marks a parameter that ends up at its bound as not identified and reports the fit as not trustworthy.
Asking a network to regress “loss of active material” from a single spectrum under that degeneracy means it can only learn a conditional mean, and it collapses the moment it leaves the training distribution. Breaking the degeneracy requires sweeps — spectra from the same cell at multiple operating points, taken jointly:
| Sweep dimension | What it separates | Physical basis |
|---|---|---|
soc |
Thermodynamic state vs kinetic degradation | Open-circuit potential varies with intercalation fraction \(\theta\), while ohmic resistance barely moves with SOC |
temperature_c |
Processes with different activation energies | Each rate constant follows its own Arrhenius dependence, and a thermal sweep pulls them apart |
protocol_id |
Path-dependent hysteresis | DST, WLTP and similar load profiles leave different concentration-gradient histories |
Practical consequence: treat one cell’s sweep set as a single training sample rather than treating each spectrum as independent. The latter wastes exactly the information that breaks the degeneracy, and it creates severe within-group leakage — adjacent SOC points from one cell landing on opposite sides of the split let the model cheat by interpolation.
4. Validity checking with Kramers-Kronig
Not every computed curve is a legitimate impedance response. The KK relations hold for any linear, causal, stable, time-invariant system — a violation means your spectrum breaks at least one of those four premises, usually because linearisation failed at a deeply degraded operating point or the Jacobian was badly conditioned.
The practical approach is not to evaluate the KK integrals directly (they require extrapolation to infinite frequency, which introduces its own error) but to run a linear KK test: fit the spectrum with a bank of pure RC elements, which satisfy KK by construction, and look at the residual.
import numpy as np

def linear_kk_residual(freq, z, n_rc=40):
    """Fit the spectrum with n_rc RC elements at log-spaced time constants.
    An RC network always satisfies KK, so whatever cannot be fitted is the
    KK violation. Returns relative residual; empirically, more than a few
    percent means the spectrum is suspect."""
    w = 2 * np.pi * np.asarray(freq)
    taus = np.logspace(np.log10(1 / w.max()), np.log10(1 / w.min()), n_rc)

    # Basis: 1/(1+jw*tau) per RC, plus a constant term for R_ohm
    A = np.column_stack([1.0 / (1.0 + 1j * w[:, None] * taus), np.ones((len(w), 1))])

    # Complex least squares: stack real and imaginary parts into one real system.
    # Fitting them separately discards the constraint that both must come from
    # the same parameter set - which is exactly what KK expresses.
    A_ri = np.vstack([A.real, A.imag])
    z_ri = np.concatenate([z.real, z.imag])
    coef, *_ = np.linalg.lstsq(A_ri, z_ri, rcond=None)

    z_fit = A @ coef
    return float(np.linalg.norm(z - z_fit) / np.linalg.norm(z))

resid = linear_kk_residual(frequencies, z)
if resid > 0.02:
    print(f"KK residual {resid:.3f} is high; flag this spectrum, exclude from training")
Real and imaginary parts must be solved jointly. Fitting them separately drops the constraint that both arise from one shared parameter set — and that constraint is the substance of the KK relations.
5. Label schema: fields you cannot omit
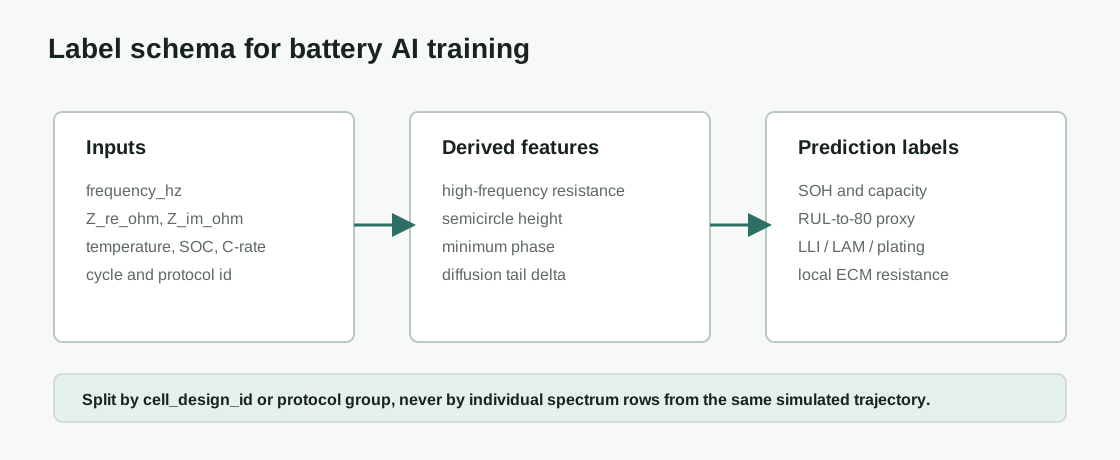
A dataset holding only Z_re and Z_im is unusable. Six months later, given a curve, you cannot tell whether the change came from temperature, SOC or a degradation mechanism.
| Field | Meaning | Why it cannot be dropped |
|---|---|---|
frequency_hz |
Frequency sample points | The impedance tensor must align strictly with the frequency axis; samples on different grids cannot be mixed directly |
z_re, z_im |
Real and imaginary impedance | Forms the Nyquist and Bode features |
soc, temperature_c |
Operating point | Separates degradation effects from thermodynamic state effects — see section 3 |
model_name, parameter_set |
DFN/SPMe/SPM and parameter provenance | Spectra from different physical models must never be conflated |
lli, lam_neg, lam_pos, soh |
Degradation labels | Supervision targets; the two electrodes’ LAM must stay separate |
solver_status |
Whether the solver converged | Stops failed samples from being read as real physical responses |
kk_residual |
Linear KK test residual | Quantifies validity so downstream can filter by threshold instead of all-or-nothing |
sweep_id |
Grouping key for one cell’s sweep set | The basis for group splitting, and the unit that breaks parameter degeneracy |
6. Three anomalies to check every time
Scan for these after every generation run. None of them raises an exception:
- Negative real part: a passive system’s impedance has non-negative real part. A negative value is always a numerical artefact — discard it rather than taking the absolute value.
- Low-frequency spikes: the low-frequency end is slowest to solve and most prone to non-convergence. Check
solver_statusand difference adjacent points — a genuine Warburg tail is smooth, spikes are the fingerprint of a failed solve. - Repeat runs disagreeing: the same SOC, temperature and parameters run twice must agree bit for bit — this is a deterministic PDE solve. Disagreement means an unfixed random source or solver state contamination, and must be resolved before generating more.
7. Splitting and leakage
The easiest mistake is putting adjacent operating points from one degradation trajectory into both train and test. The model memorises the local shape of that simulated trajectory instead of learning generalisable electrochemistry. Split by sweep_id or cell_design_id:
from sklearn.model_selection import GroupShuffleSplit

splitter = GroupShuffleSplit(test_size=0.2, random_state=42)
train_idx, test_idx = next(splitter.split(X, y, groups=sweep_id))

# Assert it in the pipeline
assert not (set(sweep_id[train_idx]) & set(sweep_id[test_idx])), "group leak"
8. Generation pipeline
cd pybamm-ai-data-lab
python3 -m venv .venv
source .venv/bin/activate
pip install -r requirements.txt

python src/run_all.py --backend pybamm --workers 8 --precision float64
--precision float64 is not an optional performance knob. EIS solving involves inverting ill-conditioned matrices, and float32 accumulates visible error at the low-frequency end — showing up as jitter on the Warburg tail that looks like physical noise but is just insufficient precision.
A closing principle: interpolated results from a degraded surrogate must never be mixed into the main training tensor. Solver tolerance failures mark genuinely stiff physical states (sub-zero temperature near 0% SOC); those must be flagged or masked explicitly, never silently imputed — imputation dresses “we do not know” up as “we measured it”.
References
- PyBaMM EIS Simulation DAE Solvers
- pybamm-eis (archived; merged into PyBaMM core)
- Physics-based battery model parametrisation from impedance data
- PyBOP: battery model optimisation and parameterisation
The underdetermined single spectrum from section 3 is the same problem in the time domain: fitting PyBaMM parameters and identifiability covers how to tell whether an optimiser’s numbers were measured or merely fitted.